| https://www.next-finance.net/en | |
|
Opinion
|

A tale of two worlds: a robust business cycle in the US and a draining of liquidity in the rest of the world
After President Trump signed the ’Tax Cuts and Jobs Act’ into law on 22 December 2017, we expected corporate earnings growth to be strong in 2018. In fact, it has been far stronger, as the direct effect of the tax cut on corporate earnings was further magnified by the acceleration in economic growth.
Article also available in :
English ![]() |
français
|
français ![]()
After President Trump signed the ’Tax Cuts and Jobs Act’ into law on 22 December 2017, we expected corporate earnings growth to be strong in 2018. In fact, it has been far stronger, as the direct effect of the tax cut on corporate earnings was further magnified by the acceleration in economic growth.
Indeed, we initially foresaw earnings growth of about 15% for 2018, but this is now on track to grow by some 25%, with around 6-8% driven by the tax cut. By comparison, over the past 60 years US earnings growth has averaged 5-7%.
Despite that strong earnings performance, the S&P 500 Index is roughly flat on the year (as at 30 November 2018) and this derating is providing investors with attractive valuation levels.
TRADE WAR, QUANTITATIVE TIGHTENING AND VOLATILITY
So what’s held the market back? The trade war with China and the associated rhetoric have been important factors. The companies that are most exposed to tariffs have seen their stock prices penalised in the market - that includes industrial and materials stocks, semiconductors and autos.
While the US Federal Reserve’s move to shrink its balance sheet was always going to trigger volatility, the extent of the October market correction took us by surprise.
Following the plain sailing of 2017 from a volatility viewpoint, 2018 has seen rougher waters with two corrections (of over 10% peak to trough in magnitude), one taking place in the first quarter, the other in the last quarter of the year. Both episodes were exacerbated by technical factors. In February/ March 2018, for example, the equity market was spooked by initial data for average hourly earnings growth, with wages ticking up by more than expected, suggesting that inflationary pressures may be building. As companies had paused share buyback programmes ahead of quarterly earnings announcements, there was little to support share prices and they fell sharply. In the event, the following wage growth report in March turned out to be less buoyant and the market bounced back to reflect the strength of companies’ reported earnings.
The more recent correction is very similar in that the market reacted to more hawkish comments from the Fed chairman on when neutral rates would be reached, a situation further exacerbated by trade war escalation. Importantly, the two corrections highlighted how much the market structure has changed since the financial crisis as ETFs and systematic investors have become more influential. On average trading days, ETFs account for about 30% of equity market volumes, but when there is a bout of volatility like in March and October 2018, ETFs account for a lot more. In October, companies were yet again on buyback blackout due to imminent third quarter earnings releases providing little buying support to the market.
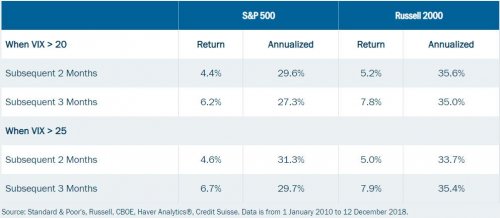
We view these two corrections as technical as much as fundamental. Also, empirical evidence suggests that when volatility levels spike to abnormally high levels, the following months tend to provide superior returns for investors as stock pair correlations and dispersions relationships normalise.
Historically, equity returns have been robust following temporary volatility (VIX) spikes (see Figure 1).
Figure 1: Performance by VIX level, 2010 to 2018

STEADY GROWTH AND ATTRACTIVE VALUATIONS
Looking to 2019, this has left the equity market trading at attractive valuation multiples. We expect economic growth to continue to be above trend, inflation to be benign and earnings growth to be a healthy 8-10%, which remains above trend. On that basis, the S&P 500 Index trades on about 15 times forward price/earnings ratios; somewhat lower than the average of 16 times. Consequently, the market is trading at a discount to historic norms yet growing faster.
As we write a lot is happening, indeed the Fed’s Jay Powell has just changed his language concerning the neutral rate from being "a long way away" to "close to". And the G20 summit saw an improvement in the China-US trade tensions with a 90-day truce declared and no further escalation during that period.
We thought the market was close to discounting a full-on trade war (25% tariffs on $500bn goods) which at worst (if there is no pricing power to offset it) could hit S&P500 earnings growth forecasts by -5% to -6%.
A resolution now seems possible and the worst-case scenario less likely after the G20 talks. Indeed, while 90 days looks like a very ambitious target, at least there is a path to discuss the core of the issues. These include: technology transfer, intellectual property protection, cyber intrusion and theft, non-tariff barriers and services and agriculture. We know that the Chinese are willing to make concessions on intellectual property, services and agriculture. Additionally, the CFIUS (Committee on Foreign Investment in the United States) has a newly enlarged remit with power to limit technology transfers. All of this suggests that while trade tensions may get worse before they get better, tariffs are likely to be temporary and reversed as and when a resolution is found.
The market is grappling with a dilemma: on the one hand we find a robust business cycle in the US and on the other, we are confronted with a liquidity or QT-induced slowdown in the rest of the world.
This is reminiscent of 2015 when we had an industrial and commodity recession within an otherwise growing economy. Then, central banks intervened and the market resumed its upward movement, so the crucial question now is whether the impact of QT on global liquidity will derail the business cycle. The market seems to fear that central banks will not respond sufficiently this time.
We continue to hold high-quality companies, with improving business fundamentals that trade at attractive valuations. This includes technology, where the rise of artificial intelligence, cloud computing, gaming and the Internet of Things will make the economy far more computing-intensive. We also continue to like banks, which are delivering higher returns on tangible capital employed and where total shareholders returns are driven by deregulation, the strength of the economy and operational leverage. Yet they trade at a discount to their historic valuations.
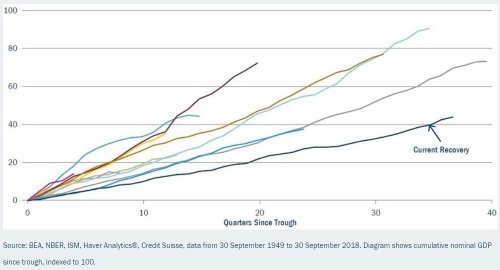
While the current recovery is one of the longest in history, it is also the slowest (see Figure 2). This should naturally extend the cycle.
Figure 2: Cumulative GDP growth post-recession, 1949-2018

We are not seeing signs of deterioration in the business cycle yet and do not believe that economic cycles die of old age either. We therefore remain cautiously optimistic and as stock pickers, we should benefit from volatility and stock pair correlations normalising next year.
Nadia Grant , January 2019
Article also available in :
English ![]() |
français
|
français ![]()
Focus

Opinion Psychology and smart beta
‘Smart beta’ sounds like an oxymoron. How smart can it be to continue using the same strategy in such fickle markets? A portfolio manager calling on all his skills (‘alpha’) in analysing market environments (the source of ‘beta’) should be able to outperform an unchanged (...)
RSS Feeds
| News Feed | |
| Jobs & Internships | |
| Trainings |
Site | English | Francais | Mobile | Facebook | Twitter |