| https://www.next-finance.net/en | |
|
Strategy
|

Is Low Volatility investing overcrowded?
One may reasonably argue that the recent flows into the Low Volatility strategies might affect their future performance because of the flow pressure on the prices of the companies that generally are selected by this investment approach. More recently, some market participants have even referred to Low Volatility investing as “a bubble”.
Article also available in :
English ![]() |
français
|
français ![]()
Introduction
Minimum Variance and Low Volatility investment solutions (together “Low Volatility” in the rest of the document) have become very popular over the last few years. Many traditional active asset managers and ETF providers now offer some kind of Low Volatility strategies, applied to single country, regional or global equity markets.
One may reasonably argue that the recent flows into the Low Volatility strategies might affect their future performance because of the flow pressure on the prices of the companies that generally are selected by this investment approach. More recently, some market participants have even referred to Low Volatility investing as “a bubble”.
We look at four objective measures of “expensiveness” to detect whether Low Volatility strategies applied to Developed Markets are overcrowded:
(i) Fund flows: one would expect large funds chasing the same stocks to have a significant market impact on those stocks. We present estimates of the global AUMs in Low Volatility funds/ETFs/mandates and compare them to the market cap of various investment universes
(ii) Fundamental valuation: a traditional measure of the “cheapness/expensiveness” of a specific stock or index is the Price to Earnings ratio. We look at the historical and current P/E of various Low Volatility indices compared to their market cap weighted benchmarks to see if Low Volatility indices appear excessively expensive by historical standards. We also look at other fundamental metrics that are relevant to Low Volatility portfolios.
(iii) Relative performance: if Low Volatility strategies are supposedly in a “bubble” mode, they must have been strongly outperforming market cap weighted indices in the recent period. We look at the recent performance of Low Volatility indices and try to assess if their recent behaviour looks abnormal from a historical perspective
(iv) Quantitative approach: when investors trade stocks with similar characteristics (low volatility in this case) one would expect their cross-correlations to increase relative to the correlations of the overall market. We use a quantitative measure proposed by Deutsche Bank to detect whether low volatility stocks show any signs of herding.
1- A fund flows approach
- Current AUMs in Low Volatility mutual funds & ETFs stand at $31.2bn globally [1]. This estimation does not include mandates for which information is not publicly available. An estimate would be to assume the same AUMs for mandates on low volatility strategies, hence a total estimate of $62.4bn.
- The current free float market capitalization of the MSCI World (Developed) Markets is $30.7trn [2]
- Low Volatility AUMs therefore represent around 0.2% of the global market capitalization of Developed equity markets
- One might argue that what matters is not the share of the global markets being owned by Low Volatility managers but rather the share of low volatility stocks capitalization owned by the same managers. Below are the total market caps in USD of some Low Volatility indices (as of Oct 31st 2013). We present scenarios in which Low Volatility managers follow the same index and own a certain % of the market cap of each index. For example, if the AUMs levels for the products tracking the Ossiam US Minimum Variance Index reach $129bn, they will own collectively 2% of the market capitalization of the constituents of this index [3]. We are currently very far from this level of AUMs, and definitely far from the 10% capitalization share of the traditional index funds, like S&P 500 [4].

2- A fundamental valuation approach
- An extensive analysis of fundamental biases of Minimum Variance portfolios was presented in the Ossiam Research Paper Fundamental profile of the Ossiam Minimum Variance indices (2013). Here we recall the main findings of the paper
- According to this study, in terms of P/E, Low Volatility indices often trade at a slight premium to the market as investors usually value the stocks with the ability to deliver strong and recurring cash flows. After a phase of strong growth in earnings, those companies have usually gone through a phase of multiple expansions, rewarding their accession to the status of successful company
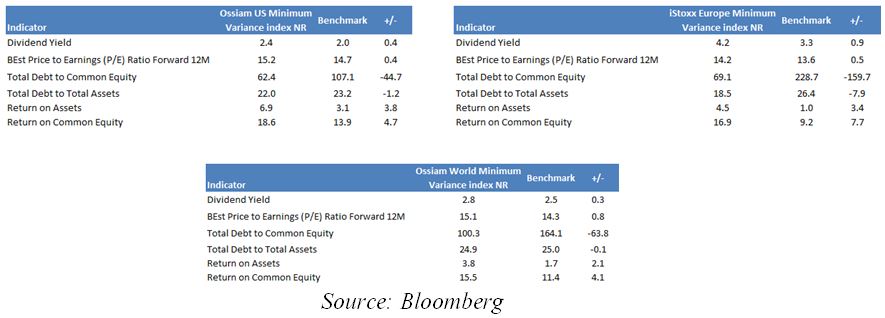
- Below are the current and historical P/E ratios for some Low Volatility indices compared to their Benchmarks:
- As can be seen above, the Low Volatility indices are currently slightly more expensive than their Benchmarks. However, the magnitude of the difference is rather small and is in line with its historical average value
- As is shown in the full study, the disconnections between the valuations of Low Volatility indices and their Benchmarks (6 to 10 points of P/E ratio) coincide with periods of extreme stress in the market (March 2009 for example)
- Current values of the fundamental indicators (as of October, 31st 2013) confirm the findings of the study: stocks in Low Volatility portfolios on are concentrated on less indebted and more profitable companies than their market cap weighted Benchmarks, which explains why they trade at a premium to the market portfolio
3- A relative performance approach
- The chart presented on the side shows the ratio historical values of Low Volatility indices over their respective Benchmarks since 2001. Periods of massive overperformance were observed on two occasions (February 2003 & March 2009, corresponding to the bottoms of bear markets)

- Low Volatility strategy applied to Developed Markets have been performing in line with their Benchmarks since July 2011 (but with less volatility)
4- A quantitative approach
- In a recent study [5], Deutsche Bank Quantitative Team applied a proprietary metric to assess the crowdedness of Low Volatility strategies. The metric is based on pair-wise stock correlations, as when investors trade a group of stocks as a basket (e.g. a basket of low volatility equities) then these stocks show higher co-movements (correlation) compared to the market average, especially during market downturns. We construct a similar indicator to detect whether low volatility stocks are subject to herding [6]
- We consider the S&P 500 universe over the period 2002/2013. Each quarter, we build 10 portfolios corresponding to volatility deciles (decile #1 will contain the 50 stocks with the lowest volatilities). We then measure the average of pairwise correlations within each decile during market downturns (i.e. conditional on market losses higher than the 95% Value-at-Risk of the S&P500)
- For sake of simplicity and clarity of the presentation, we focus here on two low volatility portfolios (Buckets 1 and 2), two mid volatility portfolios (Buckets 5 and 6) and two high volatility portfolios (Buckets 9 and 10)

- Globally the conditional average pairwise correlations during the last ten years are increasing. Across all volatility Buckets, the pairwise correlations in the last 5 years are substantially higher than they were at the beginning of the previous decade
- Low Volatility stocks have consistently been showing the highest correlations among the volatility Buckets. However, since the measure is not adjusted for fundamental biases such as sector concentration, it is not possible to directly conclude that the high correlation is a result of money flows in that Bucket. This high correlation might come as well from the fact that this Bucket is concentrated in just a few defensive sectors, such as Healthcare, Utilities and Consumer Goods
- Currently, the first Bucket shows the highest conditional correlation but its value is smaller than it was during the period 2011-2012
- Moreover, the difference in conditional correlation between the first Bucket and other Buckets is not abnormally high compared to historical levels
Conclusion
In this paper, we looked at different objective measures of “expensiveness” or “crowdedness” of Low Volatility strategies applied to Developed Markets, ranging from fundamental considerations to quantitative criteria. For each criteria, there was no convincing evidence of abnormal or “bubble” behaviour of Low Volatility strategies and stocks in the recent period. Despite the recent interest to this investment style, the amount invested in this sector is small compared to the market capitalization of the low-risk stocks. These strategies do not exhibit bubble-like outperformance with respect to the market. From the fundamental point of view, the low-risk stock appear somewhat expensive, but the historical analysis reveals that this expensiveness was not generated just recently but is rather a manifestation of a premium that less indebted and more profitable companies benefit from. And finally, a correlation analysis shows that while the stocks with the lowest volatility currently exhibit higher tail correlations than in the past, this trend is also observed on the other stocks.
L’équipe Gestion & Recherche D’Ossiam , February 2014
Article also available in :
English ![]() |
français
|
français ![]()
Portfolio
Footnotes
[1] As of Oct 31st. Source Bloomberg, calculation by Ossiam
[2] As of October 31st 2013. Source MSCI
[3] Note that this number does not take into account any overlap between portfolios of different Minimum Variance strategies (e.g., the same US stocks can be included both in the US and the World Developed Low volatility strategies)
[4] Current S&P 500 index assets stand at $1.6 trillion, that is 10.11% of the total market capitalization of the index
[5] Seeking Return in Low Volatility, DB SYNDEX Portfolio Strategy, May 2013
[6] Note that the relationship between this indicator and future performance is far from obvious. For example, Low Volatility stocks were showing the highest correlation in March 2007, before the market downturn and subsequently overperformed the market by a significant margin. Analysts at DB also noted that High Dividend strategies have been showing signs of overcrowding almost continuously in the last 10 years but this did not prevent them to be one of the best investment strategy over the same period
Focus

Strategy CPR AM has recently launched CPR Invest – Global Disruptive Opportunities | A look back at an accelerating phenomenon: disruption
The recently theorised phenomenon of "disruption" is defined as a process whereby a product, a service or a solution disrupts the rules on an already established market. Technological progress, along with the globalisation of trade and demographic changes are now helping to (...)
Releases
Analysis
Advertising
Zoom
-
European crisis
-
Hidden assets
-
Multi-asset funds
-
Smart Beta
-
Strategies on divide
-
Alternative Risk
-
Infrastructure
-
China
-
Gestion Obligataire
-
Gestion Action
-
ETF Actions américain
-
Actions Thématiques
-
Special Investisseme
-
Économie bleue : (...)
-
Les thématiques (...)
-
L’IMPACT CHEZ CPR
-
ACTIONS THÉMATIQUES
-
La voie vers l’écono
-
Comment les investis
-
Assurer l’avenir (...)
-
Forex
-
Mory Doré’s column
-
Éclairages Économique
-
Solvency II
-
Managed Accounts
-
Les Derivés Total
-
Contrats à terme (...)
-
France’s debt
-
Recherche Quantitati
-
The french marketpla
-
RSS Feeds
| News Feed | |
| Jobs & Internships | |
| Trainings |
|
|
Site | English | Francais | Mobile | Facebook | Twitter |