| https://www.next-finance.net/en | |
|
Opinion
|

Curve Steepening – Already Been There?
Most developed market yield curves have suffered bear steepening over the past few weeks, despite quantitative easing (QE). This has been largely due to a less dovish US Federal Reserve (Fed), a change in the Bank of Japan’s policy, the risk of tapering by the European Central Bank (ECB), and the return of inflation (albeit still mild).
Most developed market yield curves have suffered bear steepening over the past few weeks, despite quantitative easing (QE). This has been largely due to a less dovish US Federal Reserve (Fed), a change in the Bank of Japan’s policy, the risk of tapering by the European Central Bank (ECB), and the return of inflation (albeit still mild). While we may not retrace previous sell-offs, it could be worth moving from a long duration bias to a more neutral stance – looking for return drivers from credit spreads and steeper curves rather than ultra-long duration.
Recent studies have shown that performance of risk assets has been primarily driven by central banks’ actions. This has led to strong correlations of performance and pushed investors searching for yield into less traditional sectors such as equities, through dividend strategies for example. Meanwhile, in 2016, duration has been the driver of portfolio growth. So as the ‘doves cry’, the curves may steepen and duration risk must be controlled.
It all started in early September with the traditionally dovish Fed board member Rosengren calling for a rate hike in the US sooner rather than later. Then the Bank of Japan announced moving to YCC mode (Yield Curve Control), thus implying a change in how they look to let the Japanese government bond (JGB) yield curve steepen, locking the 10-year JGB close to 0%. Meanwhile, the ECB’s potential taper talks made the headlines as the threat of deflation seems to be fading away, and that the ECB could be running short of paper to buy before March 2017.
Markets are watching the next trail of events, notwithstanding the US elections and the December Fed and ECB meetings; this could help keep a lid on 10-year yields, but recent economic and inflation figures may give room for a further steepening of the curves.
Steeper yield curves? Where to from here?
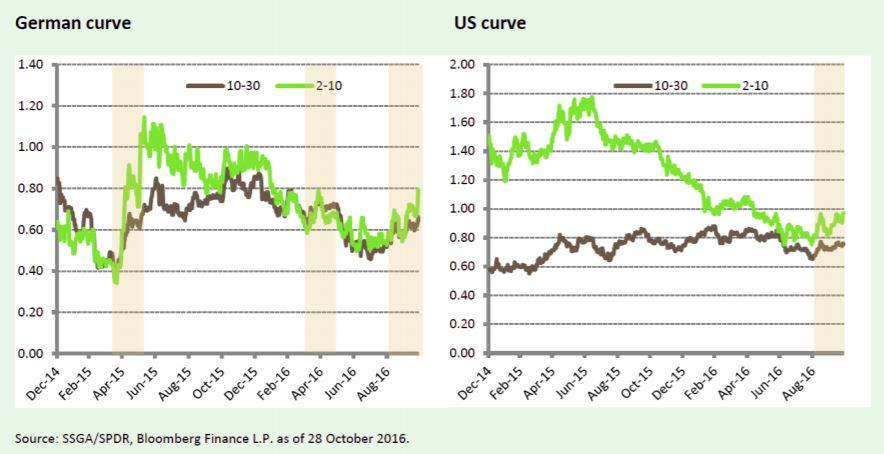
Last week’s moves in the German 10-year yield are quite rare since the beginning of ECB QE in 2015. Moves of +0.08% or more in a day happened only 12 times since 21 January 2015. Are we in a ‘taper tantrum’ like in May 2015? It may be too early to tell. Nevertheless, we have seen such moves in the past, which were followed by periods of bull flattening (see Figure 1). On the US side, the move is more gradual. We are back to levels last seen a year ago. We don’t believe the Fed will announce a change on 2 November, and therefore focus on the December meeting instead. Would a hike mean a remake of early 2016? If so the increase in bond yields could soon run out of steam.
Figure 1: Steeper bellies – Intermediate (2-10 year) and long end (10-30 year) spread evolutions
Break-evens Calling for US TIPS
Inflation is indeed coming back, not roaring for sure, but it has pushed higher as 2015’s oil price declines are disappearing from the year-on-year figures. This drive in 10-year yields going up across the board is fuelled by the removal of deflation fears. With core CPI in the US at 2.2% and 0.8% in the euro area, real 10-year yields are still negative. After two years of downside inflation surprises, the deflation threat seems to be easing, pushing break-evens higher. US 10-year break-evens trade around 1.73% (at the time of writing) while euro equivalents are at 1.07%. Such developments are favourable for US Treasury Inflation Protected Securities (TIPS). Figure 3 shows the past three-year change in break-even inflation, highlighting the recent trend higher across the board.
Figure 2: Change in break-even inflation – Appetite is picking up

Move to Cyclicals: Good for Spreads - A Look at the Belly of the Curve
Spreads have continued to tighten in sterling, US dollar and euro corporate indices despite the recent increase in treasury yields. Management of interest rate risk in such a context warrants a more pointed duration exposure. Indeed, the Barclays US Corporate 3-10 Year Index currently has a duration of circa 5.3 vs. 8.4 in an all maturity index like the iBoxx US$ Liquid Corporate Index. In the past 10 years the duration of the Barclays All Maturity IG Corporate Index has been extended by 1.5, from 6 to 7.5. The case for controlling duration thus becomes natural. Maturity-based indices offer this opportunity to investors to more precisely adjust their portfolio. In Figure 4 we look at the evolution of yield and spreads in the intermediate part of the curve recently.
Figure 3: Yields backing up, spreads tightening – OAS in bps (LHS) and Yield to Worst in % (RHS)

Antoine Lesné , Tapiwa Ngwena , November 2016
Focus

Opinion Psychology and smart beta
‘Smart beta’ sounds like an oxymoron. How smart can it be to continue using the same strategy in such fickle markets? A portfolio manager calling on all his skills (‘alpha’) in analysing market environments (the source of ‘beta’) should be able to outperform an unchanged (...)
Releases
Analysis
Advertising
Zoom
-
European crisis
-
Hidden assets
-
Multi-asset funds
-
Smart Beta
-
Strategies on divide
-
Alternative Risk
-
Infrastructure
-
China
-
Gestion Obligataire
-
Gestion Action
-
ETF Actions américain
-
Actions Thématiques
-
Special Investisseme
-
Économie bleue : (...)
-
Les thématiques (...)
-
L’IMPACT CHEZ CPR
-
ACTIONS THÉMATIQUES
-
La voie vers l’écono
-
Comment les investis
-
Assurer l’avenir (...)
-
Forex
-
Mory Doré’s column
-
Éclairages Économique
-
Solvency II
-
Managed Accounts
-
Les Derivés Total
-
Contrats à terme (...)
-
France’s debt
-
Recherche Quantitati
-
The french marketpla
-
RSS Feeds
| News Feed | |
| Jobs & Internships | |
| Trainings |
|
|
Site | English | Francais | Mobile | Facebook | Twitter |